
Screenshots
Every tab in the dashboard, at a glance. All shots taken against a real gateway with simulated live feeds routed through it — the thumbnails and status dots aren't mockups.
Operate
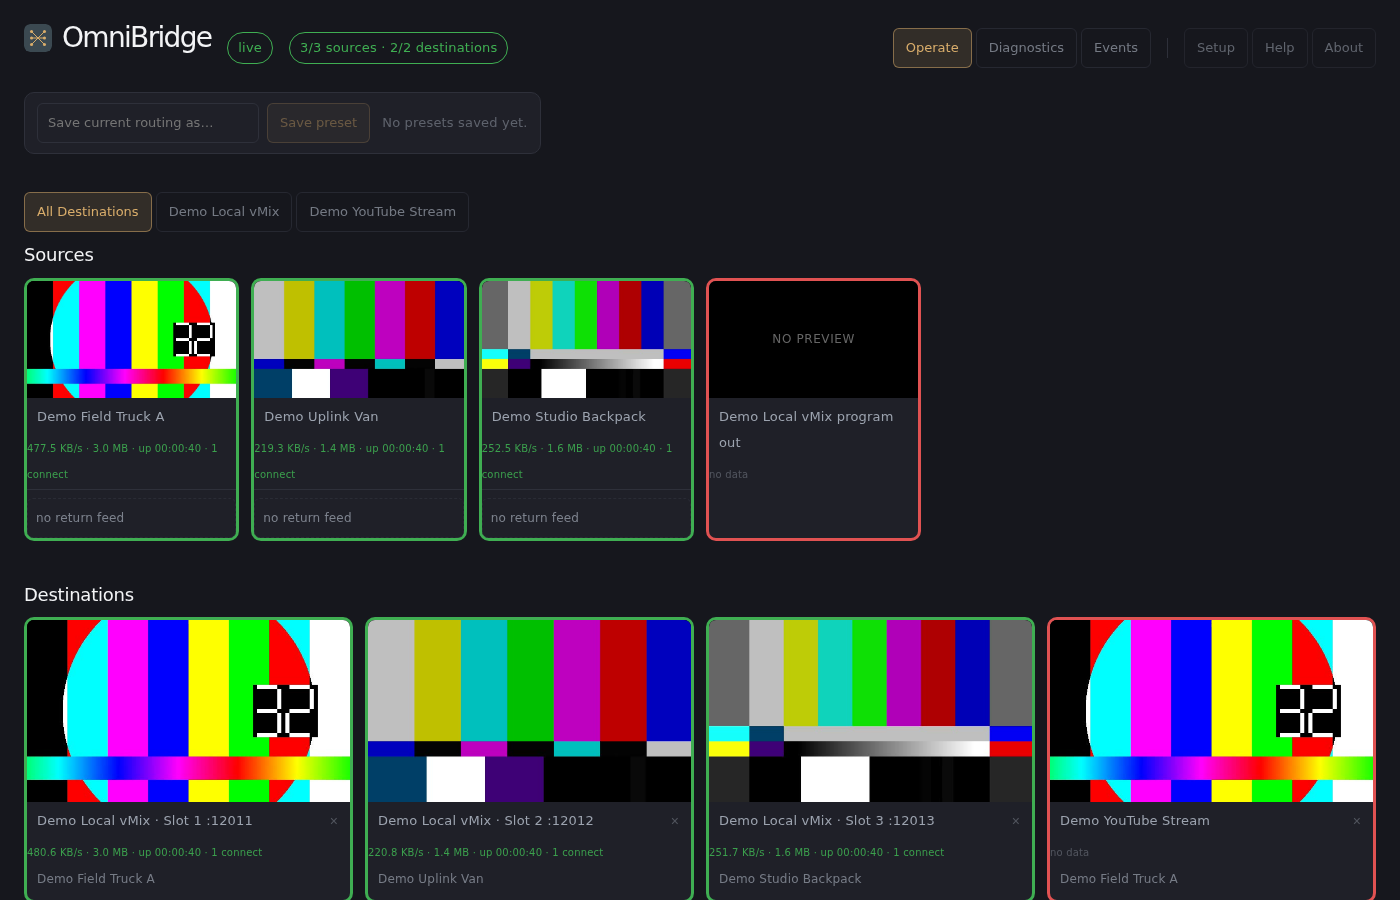
The default view — every source and destination as a draggable tile, live thumbnails, color-coded status.
Setup
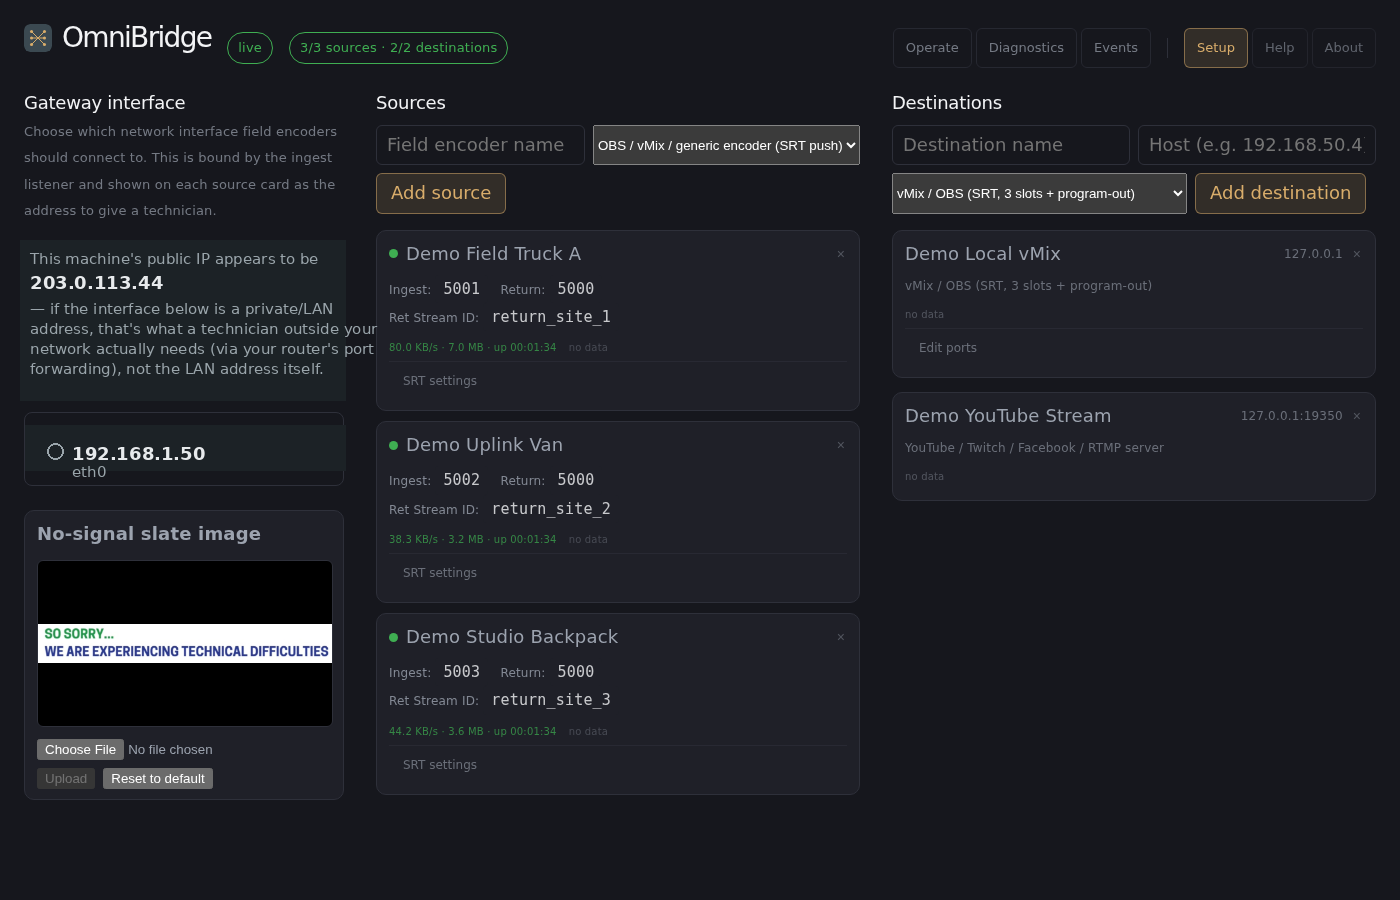
The gateway's network interface panel, alongside the Sources and Destinations columns where everything gets added.
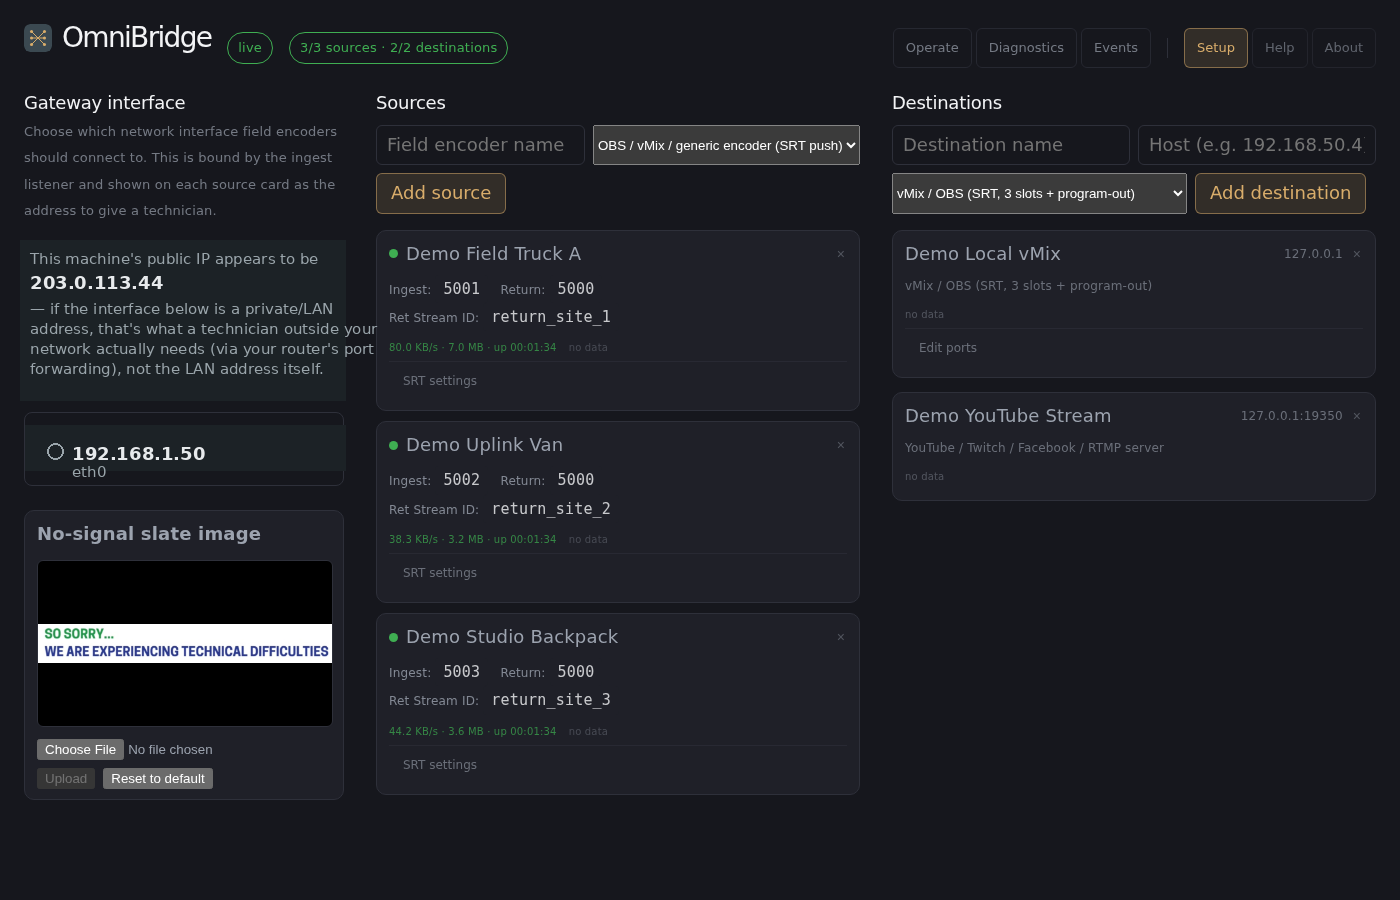
Sources and destinations, each with its own live traffic stats next to the status dot.
Diagnostics
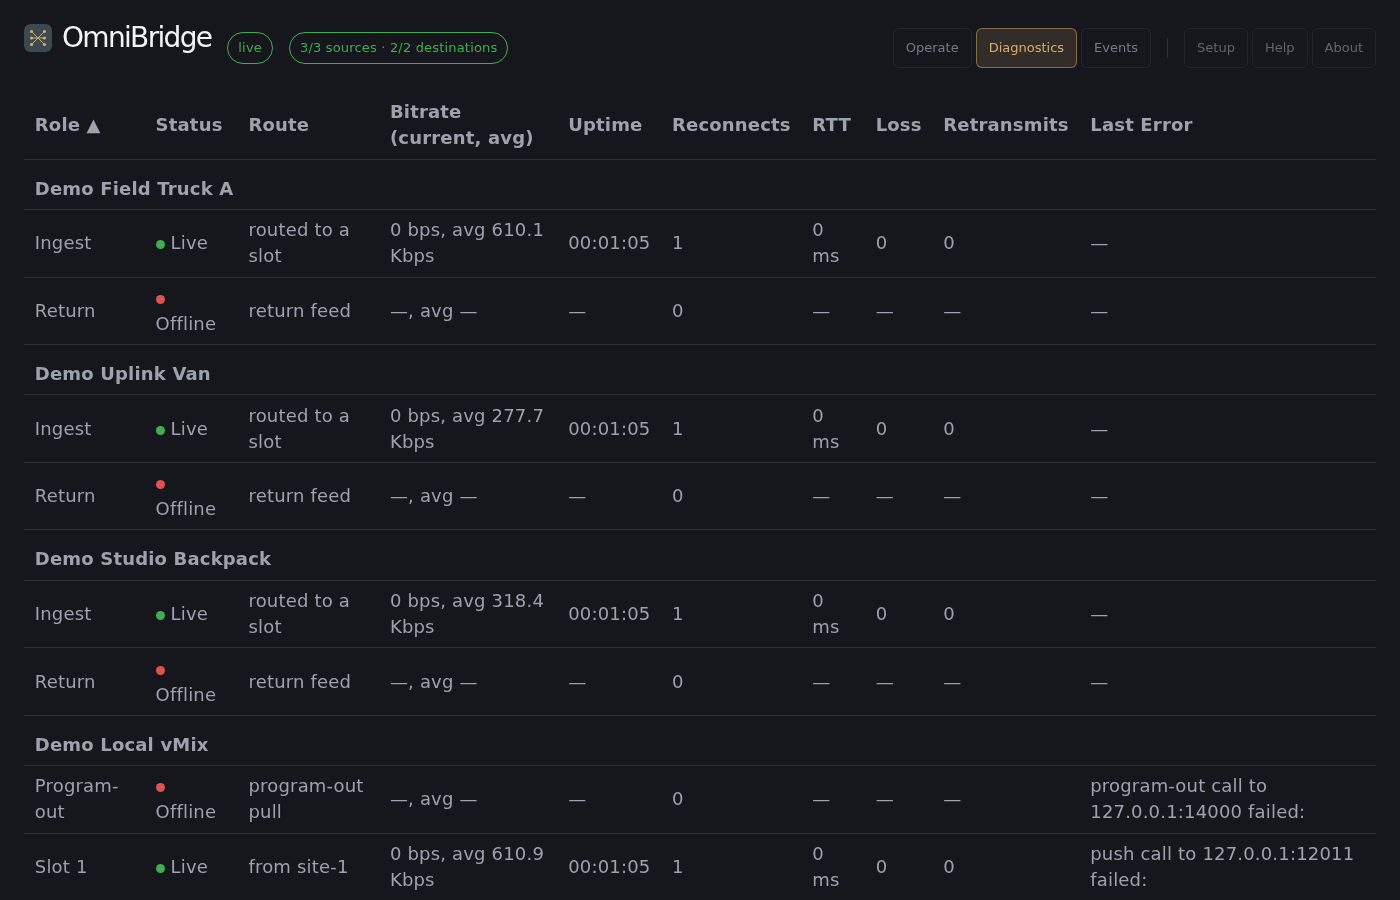
Per-connection RTT/loss/retransmits, grouped by endpoint, with the actual error text on a failed connection.
Events
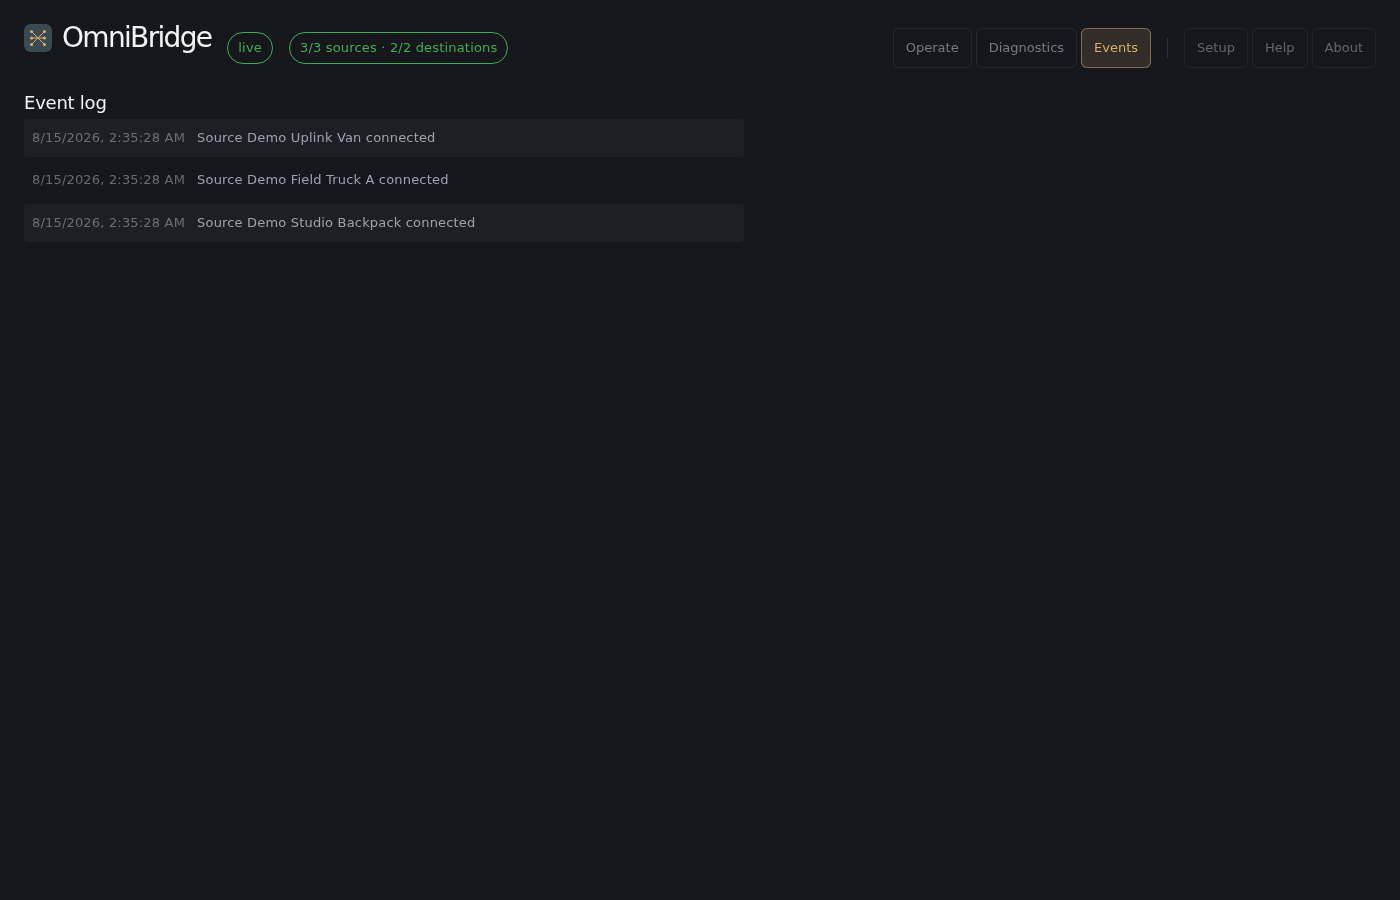
A timestamped log of every route change, preset apply, and connect/disconnect for the current session.
About
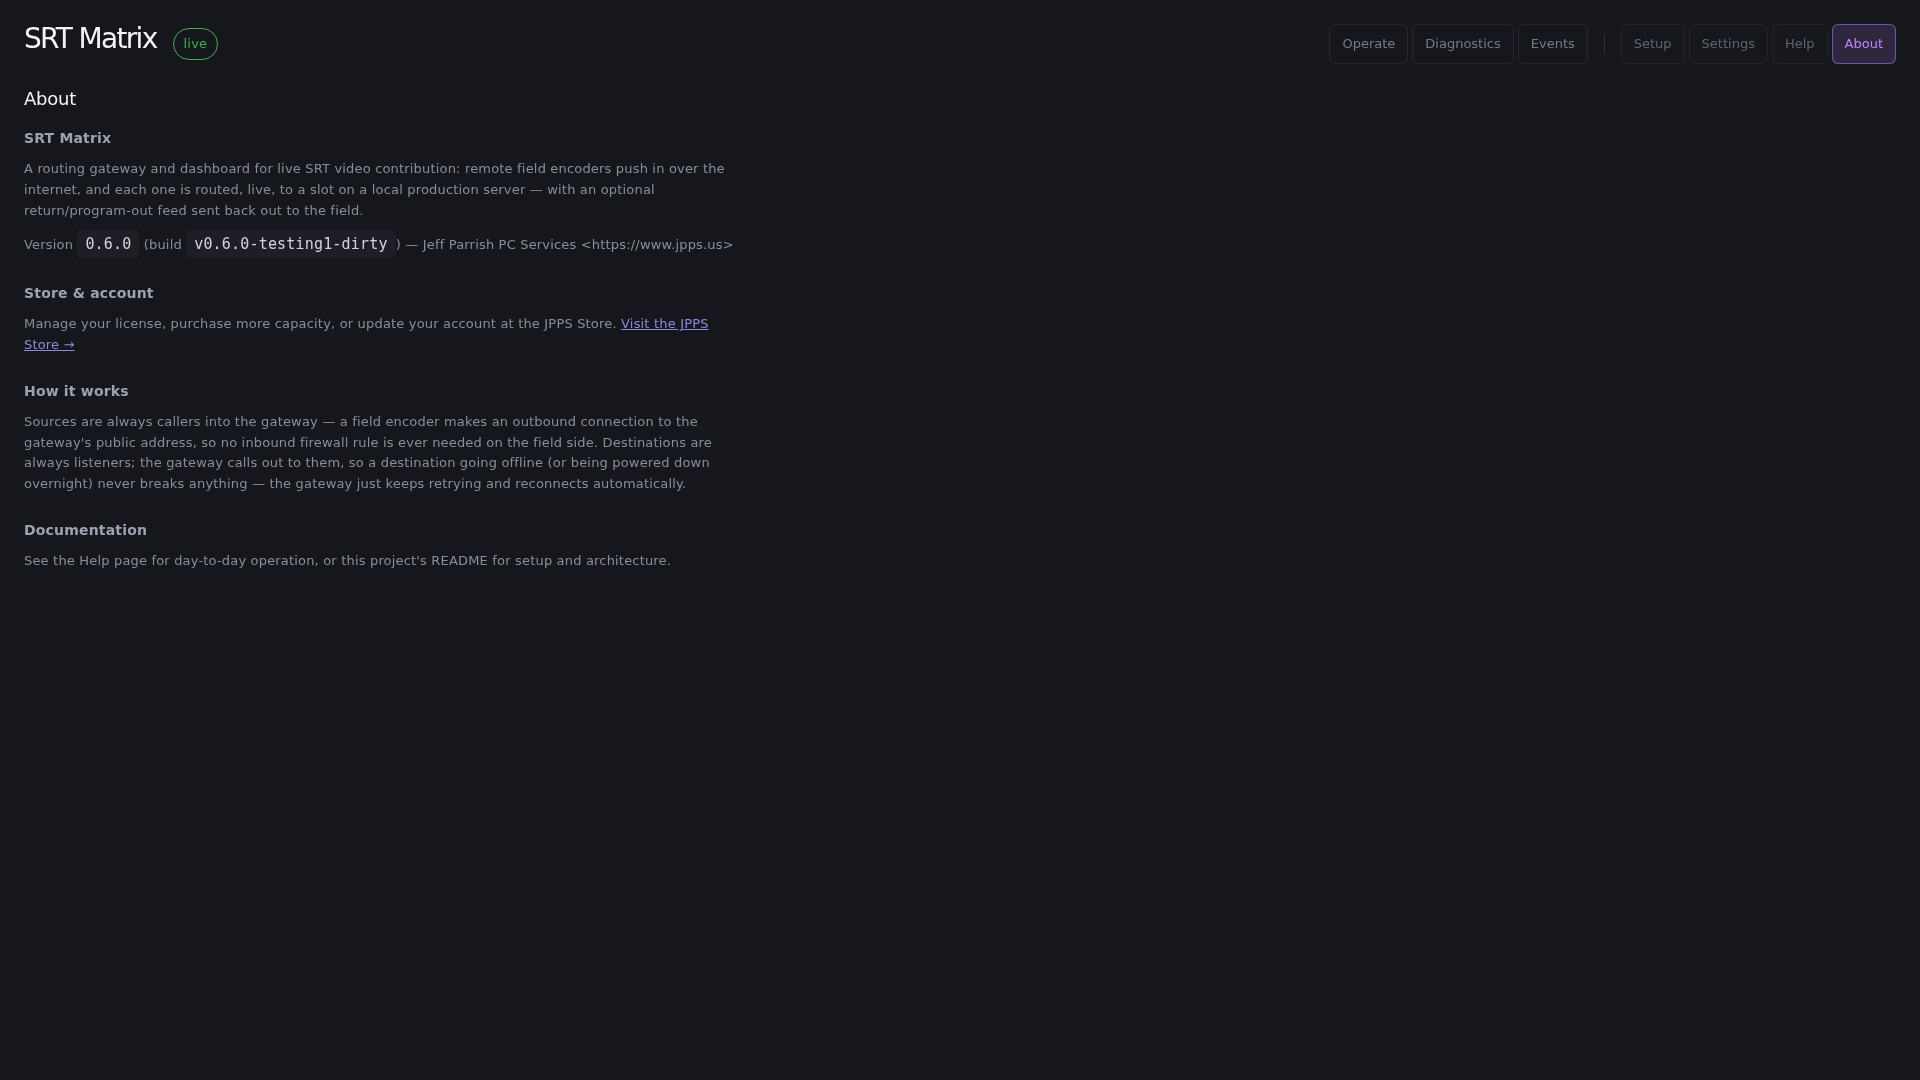
Running version, and license activation/status — also where a self-service trial starts.